Sign up: Designing Enterprise UI Directly on Production Code

What are best AI tools? Take the State of AI survey

Builder.io
Builder.io
Contact sales

Sign up: Designing Enterprise UI Directly on Production Code

What are best AI tools? Take the State of AI survey

Builder.io
Builder.io
< Back to blog

Web Development

How to Inspect Interactions in the Browser

February 14, 2023

Written By Sami Jaber

The other day, I tried to debug this autocomplete list’s broken styles:
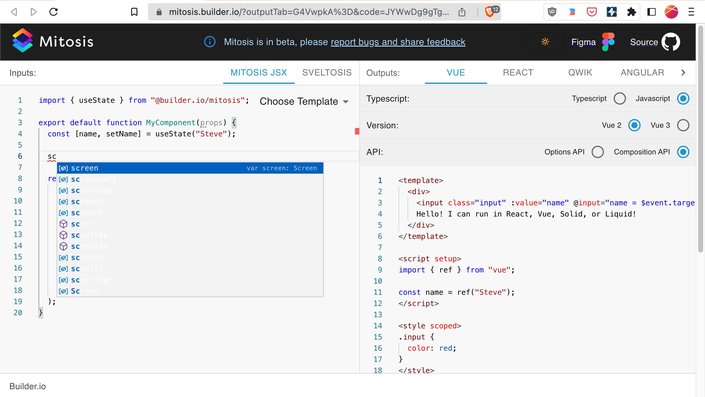
A screenshot of autocomplete broken styles.

But as many of you have experienced, when you click in your console, that moves focus out of your webpage, and the popover goes away! In this case, I can’t even right-click the popover to click Inspect Element:

I looked around and found two wonderful solutions to this problem in Chromium browsers.

Solution #1: Emulate Focus Page

Open your console, press Cmd+Shift+p to open the command palette, and search for Show Rendering :
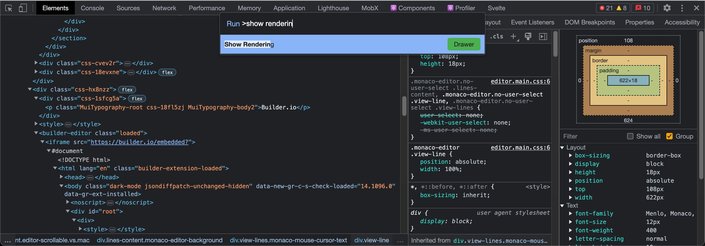
A screenshot of a search in the command palette in chrome devtools for "show rendering".

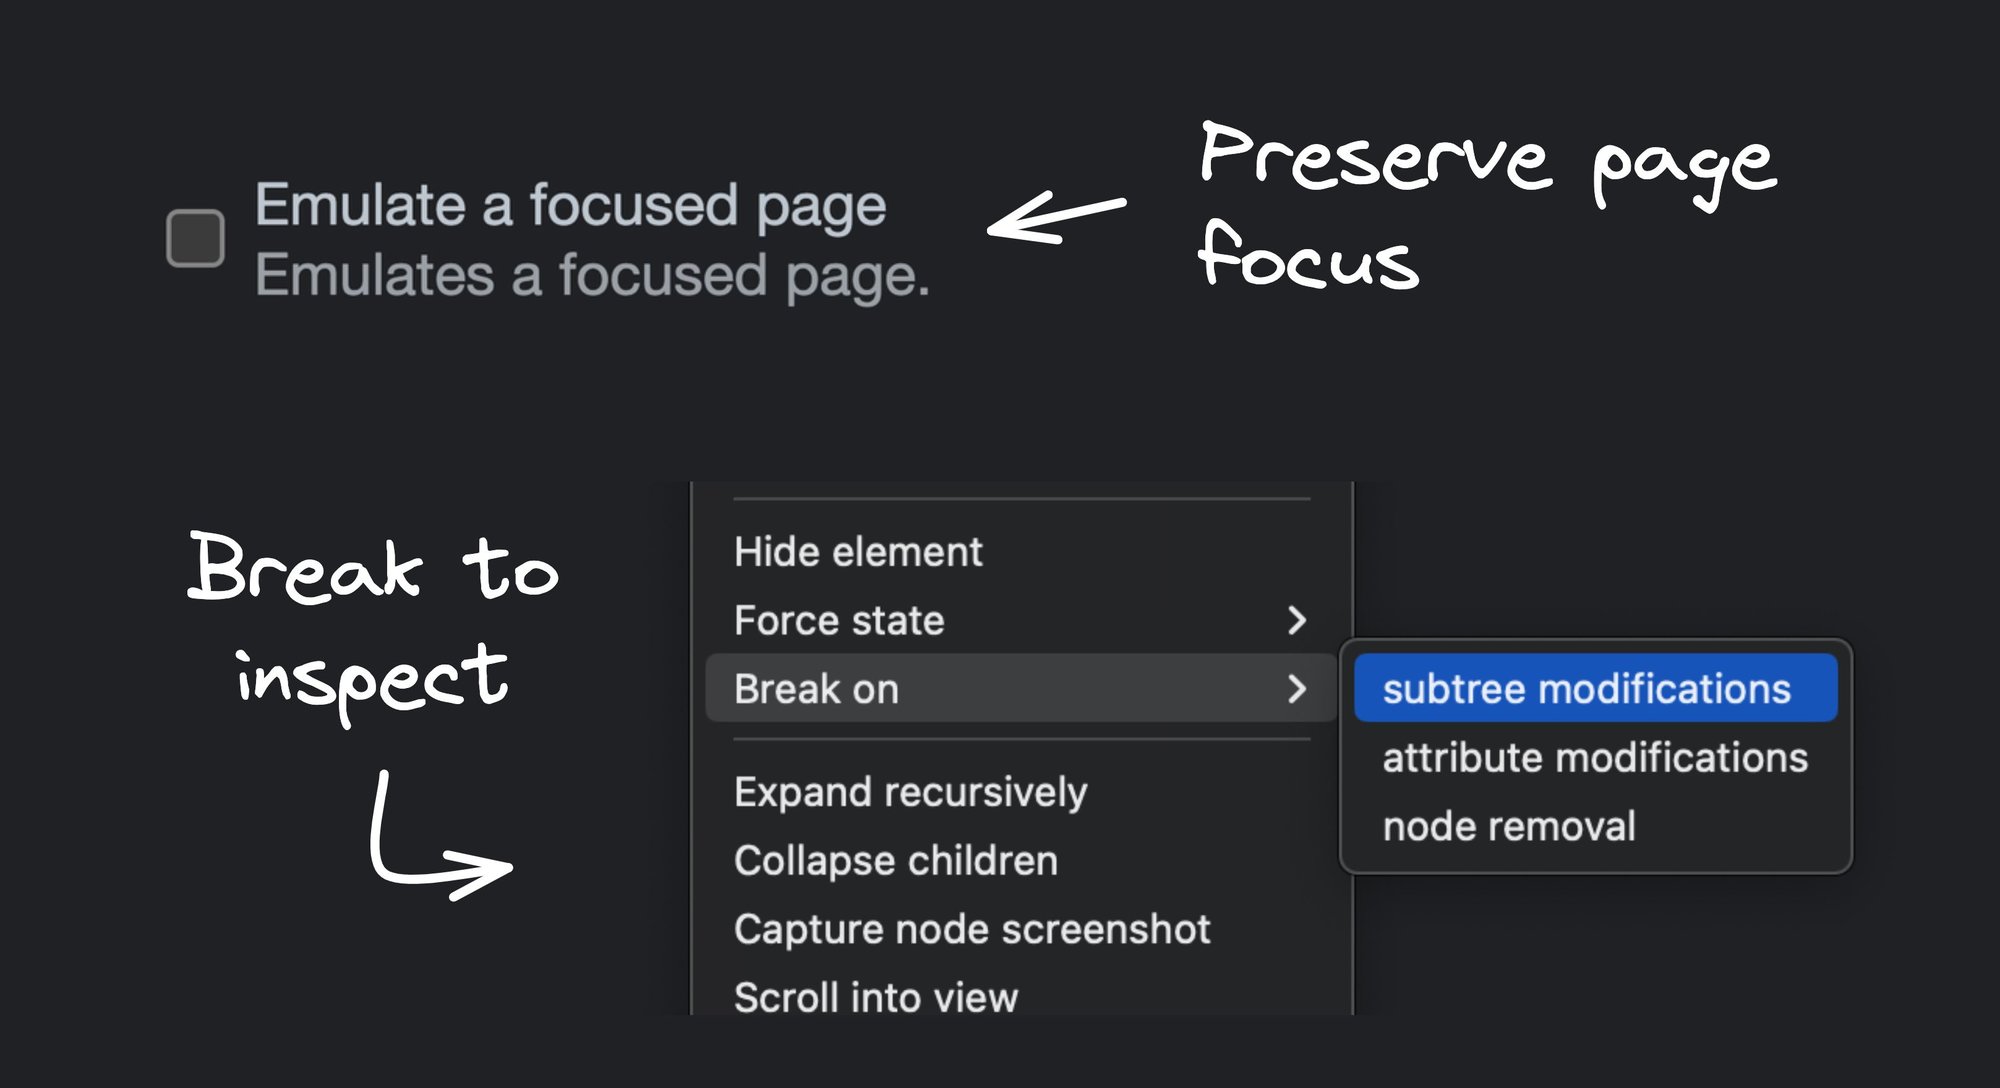
This opens a Rendering tab, where you can enable Emulate a focused page.
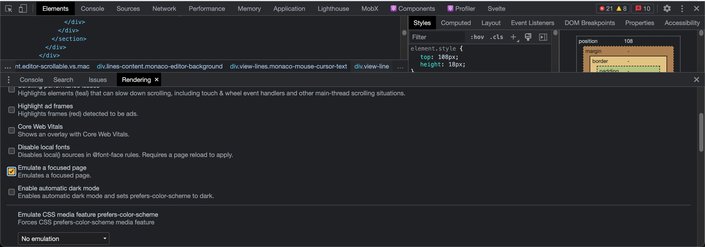
a screenshot of the Rendering pane inside devtools showing "emulate a focused page" checkbox selected.

This will preserve focus when you click around in your console.

Solution #2: Break On Subtree Modifications

This one is less practical for this particular example, but can be really useful in situations that have nothing to do with focus. You can COMPLETELY pause JS and enter debugging mode whenever a portion of the HTML has any modifications happen to it!

You start by adding a breakpoint to the subset you care about. In this case, I’ll choose the entire code editor area:
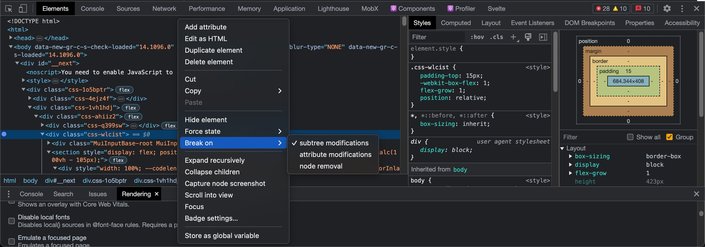
A screenshot of devtools element pane with the sub menu showing and highlighting "break on".

And now, this is what happens when I type a character in the editor:

As you can tell, this requires stepping a lot in the debugger. I prefer solution #1 to preserve focus, but I can see myself using the Break On feature for other complex interactions, especially if I want to jump into the JS code!

Conclusion

Hopefully, you’ll be able to use these tools the next time you want to debug your client-side UIs. If you know of any other cool browser dev tools, share them with us!

Share

Twitter
LinkedIn
Facebook

Generate high quality code that uses your components & design tokens.

Try it nowGet a demo

Continue Reading
AI8 MIN
Subagents: When and How to Use Them
WRITTEN BY Alice Moore
February 3, 2026
AI9 MIN
Best LLMs for coding in 2026
WRITTEN BY Matt Abrams
January 28, 2026
AI8 MIN
Lovable Alternatives for 2026
WRITTEN BY Alice Moore
January 27, 2026

Product

Visual CMS

Theme Studio for Shopify

Sign up

Login

Featured Integrations

React

Angular

Next.js

Gatsby

Resources

User Guides

Developer Docs

Forum

Blog

Github

Get In Touch

Chat With Us

Twitter

Linkedin

Careers

© 2020 Builder.io, Inc.

Security

Privacy Policy

Terms of Service

Get the latest from Builder.io

By submitting, you agree to our Privacy Policy

  • Fusion

  • Publish

  • Product Updates

  • Design to Code

  • Headless CMS

    Multi-Brand CMS

  • Landing Pages

  • Web Apps

  • Prototypes

  • Marketing Sites

  • Headless Commerce

  • Documentation

  • Fusion Docs

  • Publish Docs

  • Figma AI to Production Code

  • AI Prototyping for Product Managers

  • Figma to Storybook

  • Figma to App Converter

  • Blog

  • Webinars

  • Guides

  • Case Studies

  • Community Forum

  • Partners

  • Affiliate Program

  • CMS Integrations

  • CMS Blueprints

  • Glossary

  • Figma to Code Guide

  • Headless CMS Guide

  • Headless Commerce Guide

  • Composable DXP Guide

  • About

  • News

  • Careers

  • Contact Sales

Security

Privacy Policy

SaaS Terms

Trust Center

Cookie Preferences

YouTube icon
Github icon
Blsky Icon
Twitter "X" icon
LinkedIn icon
Feed Icon